Understanding YouTube’s global reach is critical if you’re aiming to make an impact online. This is especially true for marketers and content creators. With millions of users logging in daily and YouTube’s ad revenue breaking records year after year, the platform is now a cornerstone of modern media.
The platform’s key statistics—covering everything from user demographics to ad engagement—offer essential insights. These numbers help shape strategies, enhance audience connection, and drive meaningful results. Whether you’re building a brand or growing a channel, having a solid grasp of these numbers is critical to navigating YouTube effectively.
YouTube usage stats
YouTube is now a daily habit for millions around the globe. Let’s take a closer look at the numbers that highlight just how integral YouTube has become in our everyday lives.
YouTube is the second most popular platform
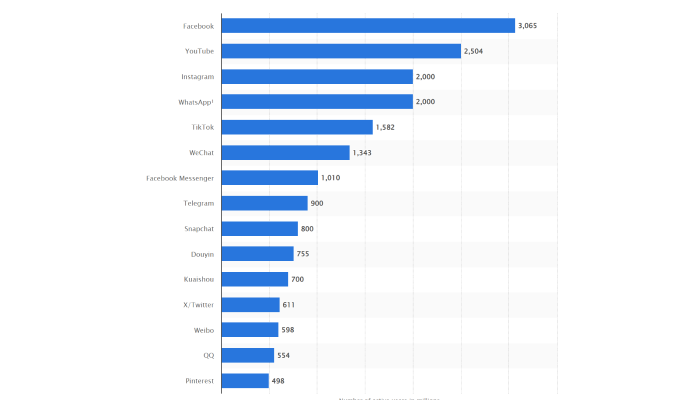
As of April 2024, YouTube boasts 2.504 billion monthly active users, making it the second most popular social platform globally. This massive user base positions the platform as a key player in social media.
The number of premium subscribers continues to increase
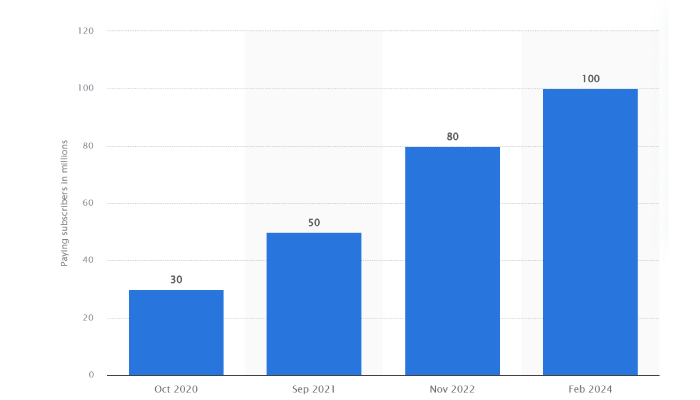
In February 2024, YouTube reached around 100 million paid subscribers across its Music and Premium services. This is twice its subscriber base from the 50 million recorded in September 2021. This highlights the increasing value users find in YouTube’s premium offerings. It also reflects its expanding influence beyond just free content.
Monthly usage varies per region
As of July 2024, users around the world spent about 29 hours each month on the YouTube mobile app. Interestingly, users in Thailand topped the charts with an average of 49 hours and two minutes per month. Meanwhile those in Switzerland spent less than 10 hours. In the United States, the average user clocked in around 26.21 hours per month on the app.
India has the most number of YouTube users
As of July 2024, India held the top spot as the country with the largest YouTube audience, boasting about 476 million users. The United States came in second with approximately 238 million viewers. Brazil ranked third, with 147 million users tuning in to YouTube. Meanwhile, the United Kingdom had around 55.7 million internet users interacting with the platform during this period.
YouTube demographics stats
Who’s really behind all those views and likes? From age groups to gender and beyond, these demographic stats give us a clearer picture of who’s spending their time on the platform.
Men remain the top audience
As of July 2024, about 54.3% of YouTube users were male, while female users made up approximately 45.7% of the platform’s audience. This slight male majority may be attributed to the abundance of gaming, technology, and sports-related videos, which traditionally attract a larger male viewership.
The audience skews male regardless of age
In the same period, 12.1% of YouTube’s global audience consisted of men aged 25 to 34, while women in the same age group made up around 9.4%. Men aged 35 to 44 accounted for 9.8% of the platform’s total audience, with women in that age range representing 8.1%. These figures highlight the platform’s strong appeal among younger and middle-aged adults.
YouTube traffic and engagement stats
When it comes to YouTube, the numbers speak for themselves. From the devices we use to tune in to where in the world we’re watching, let’s dive into the details of who’s watching what, where, and how.
A slight dip in traffic
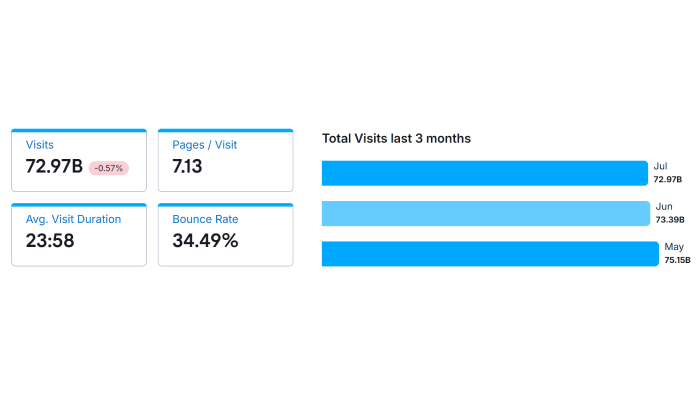
In July 2024, YouTube.com saw a total of 72.97 billion visits, marking a slight decrease of 0.57% compared to June. Users viewed an average of 7.13 pages per visit, with an average visit duration of 23 minutes and 58 seconds. The bounce rate for the month stood at 34.49%, indicating that a little over a third of users left the site after viewing only one page.
Mobile drives more traffic
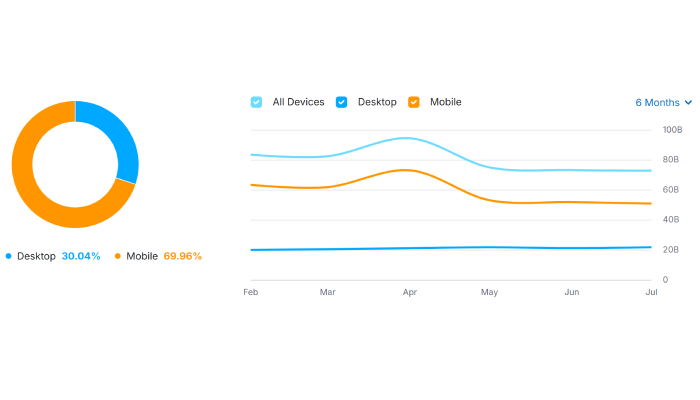
In the first half of 2024, desktops accounted for 30.04% of visits to YouTube.com, while the majority, 69.96%, came from mobile devices. This means many prefer consuming video content on the go.
Traffic, according to device, varies by region
YouTube traffic showed significant variations across different countries and devices. In the United States, which contributed 15.56% of total visits, 31.66% of users accessed the platform via desktop, while 68.34% used mobile devices.
South Korea, accounting for 10.08% of visits, had a strikingly low desktop usage at 9.59%, with 90.41% of users favoring mobile access. Meanwhile, in India, which made up 7.76% of total visits, 22.18% of users accessed YouTube via desktop, and 77.82% used mobile devices.
Engagement rates are highest for YouTube channels with 100K-1M followers
Channels with 100K-1M followers boast the highest engagement rate at 3.47%. This is likely due to their established credibility and focused content. Meanwhile, massive influencers with over 1 million followers still maintain a strong engagement rate of 3.40%. This means that even as audience size grows, these channels can sustain interaction.
On the other hand, smaller channels with 1K-5K followers struggle more, achieving only a 1.90% engagement rate. This might reflect the challenges of building a highly engaged audience at the earlier stages of channel growth.
YouTube advertising stats
Some industries are spending big bucks on YouTube ads, and it’s paying off. From cost-per-view (CPV) to retention rates, understanding which formats and devices work best can give your ads the edge they need.
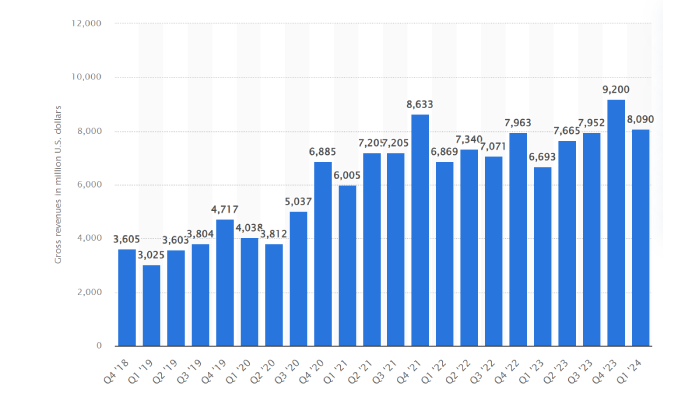
YouTube ad revenue continues to increase
In the first quarter of 2024, YouTube generated 8.1 billion U.S. dollars in global advertising revenue. This is a 21% increase from the first quarter of 2023. This solidifies YouTube’s continued strength and appeal within the digital advertising industry.
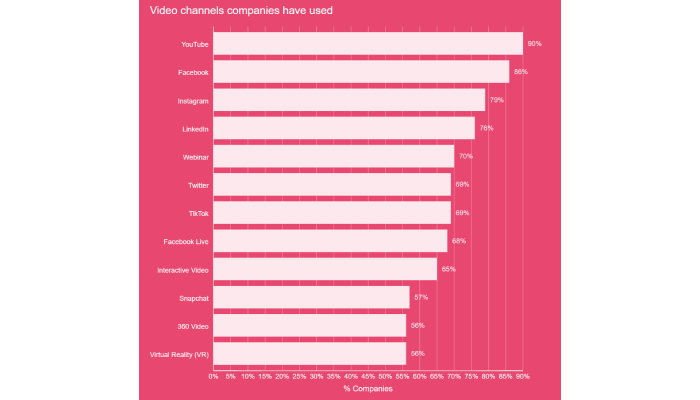
YouTube leads, but multi-platform video strategies rise
YouTube leads video marketing, trusted by 90% of marketers, followed by Facebook (86%), Instagram (79%), and LinkedIn (76%). This shows YouTube’s dominance, while Facebook, Instagram, and LinkedIn also play key roles in reaching different audiences.
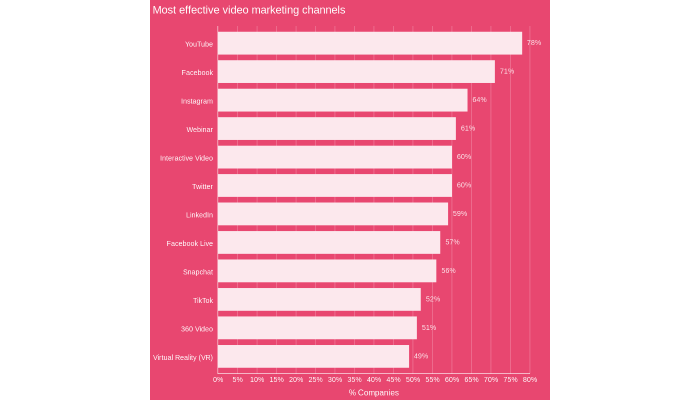
YouTube is the most successful video marketing platform
YouTube is the most effective video marketing platform, with 78% of marketers finding success there. Facebook video follows at 71%, then Instagram video (64%), webinars (61%), interactive video (60%), and Twitter/X video (60%). This likely reflects YouTube’s broad reach and video-centric nature, making it a top choice for impactful marketing.
A significant drop in CPV suggests improved efficiency
CPV decreased by 21.54% in the second quarter of 2024 compared to the second quarter of 2023. This may be due to better campaign tracking and higher consumer expenditures.
Seasonal shifts affect view rates
The view rate dropped 13% from the first quarter of 2024 to the second quarter, which may reflect a seasonal shift in viewer behaviors. Seasonal events such as holidays may lessen people’s screen time.
Mid-length video ads show strong performance
Mid-length video ads (16-30 minutes) had a 65.81% view rate and a 75% retention rate. As a result, marketers should expect higher costs for these ads. Furthermore, this length also has an ad length spend segmentation of 43%.
Single video ads offer balanced cost and retention
In the 2nd quarter of 2024, single video ads had a 53% view rate and an average budget of 1100+. This offers a better balance between ad cost and retention rates. This may be due to greater relevance, less viewer fatigue, or more focused messaging.
Mobile vs. tablet: Retention and engagement
Mobile devices had a 42% view rate, while tablets trailed slightly behind at 39%. Mobile held its own with 51% ad retention, but tablets took the lead in retention at 52%. Compelling video creatives are crucial to keep mobile users engaged—less screen real estate means more distractions.
Connected TVs dominate
Connected TVs (CTVs) were the MVPs this quarter, leading with a 66% ad retention rate and a 64% view rate. Clearly, people like watching ads when they’re on a big screen. Desktop wasn’t far behind, with a 57% ad retention and a 52% view rate.
Cost efficiency improves across mobile and CTV platforms
Mobile devices managed to reduce overall costs by 3% this quarter. But CTVs stole the spotlight as the most cost-efficient platform—costs were 5% lower than last quarter, with an impressive 20% improvement. This likely results from improved targeting precision and better ad delivery on CTV platforms
Ad view rates according to industry
Entertainment continues to dominate, with a view rate increase to 70% in Q2 2024, maintaining its top position. Business and finance also saw an uptick to 68%, while Food (CPG) significantly improved from 48% to 61%. The automotive and adult beverage industries also posted solid gains, rising to 63% and 58%, respectively.
Meanwhile, healthcare and insurance struggled slightly, dropping from 45% to 53%. Photography Publishing and art remained the lowest at 38%.
Entertainment, business, and finance likely maintained high view rates due to sustained audience interest and effective content strategies
CPV changes per industry
Most industries benefited from reduced Cost Per View (CPV) during the second quarter of 2024. Photography Publishing & Art saw the most significant drop with a 29% reduction. The science and technology and Business and finance sectors also experienced decreased CPVs by 27% and 8%, respectively. Electronics experienced a 12% decline, attributed to hyper-personalized ad experiences.
However, not all industries saw a decrease. The automotive and Food (CPG) sectors actually saw CPV increases of 20% and 32%, respectively.
YouTube video formats stats
When it comes to YouTube, video format can make all the difference in capturing your audience’s attention. Certain formats consistently outperform others, resonating more with viewers and driving higher engagement. This data can help you tailor your content to maximize its impact and reach on the platform.
The leading YouTube video format in 2024 by video views
In the first quarter of 2024, YouTube Shorts trailed behind long-form videos in terms of average views. This is despite their growing popularity. On average, short-format videos on YouTube garnered about 650 views. Meanwhile their long-form counterparts performed better, pulling in 1,500 views on average. This suggests that while Shorts are engaging, traditional, longer videos continue to attract a larger audiences.
Engagement with YouTube Shorts and videos in 2024, based on account size
The engagement rate is another story, however. In the first quarter of 2024, huge YouTube accounts (with over 50,000 followers) saw a clear preference for short-format content. They boast an engagement rate of 6.2%. In stark contrast, their long-format videos only managed a 1.72% engagement rate.
The trend was similar, though less pronounced, for Medium YouTube accounts (with 2,001 to 10,000 followers). These accounts reported nearly 3% engagement on their Short Videos. Meanwhile, their long videos only had a 0.15% engagement rate.
These numbers suggest that viewers increasingly prefer quick, easily consumable videos. This is possibly due to shorter attention spans and the rise of platforms emphasizing short-form content.
Most subscribed YouTube channels
Knowing who the top YouTube channels are gives you a clear picture of who’s really making waves on the platform. This insight can guide your approach to collaborating with these channels and also clue you in on what kinds of content are trending.
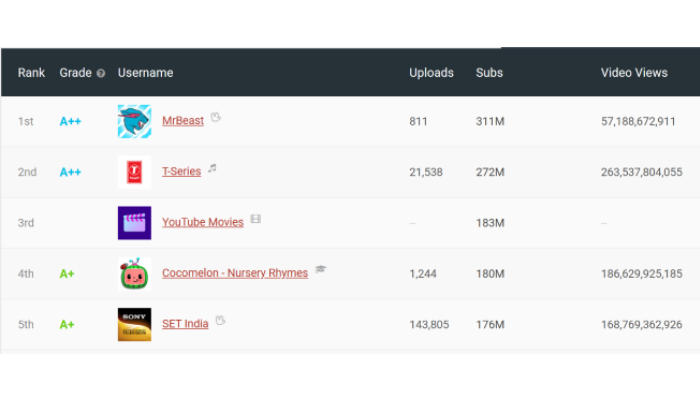
1st place – MrBeast
- Subscribers: 311 million
- Total Views: 57,188,672,911
MrBeast continues to dominate YouTube, holding the top spot. This channel remains the leader with the highest engagement and shows no signs of slowing down.
2nd place – T-Series
- Subscribers: 272 million
- Total Views: 263,537,804,055
T-Series maintains its strong position as the second most popular YouTube channel. It remains stable in second place, showing neither a rise nor a fall in the rankings.
3rd place – YouTube Movies
- Subscribers: 272 million
- Total Views: 263,537,804,055
YouTube Movies holds its ground in third place. Without specific view data, its consistent presence suggests a stable, if not growing, audience.
4th place – Cocomelon – Nursery Rhymes
- Subscribers: 180 million
- Total Views: 186,629,925,185
Cocomelon – Nursery Rhymes has dropped to fourth place. Despite its enormous popularity among younger audiences, it has experienced a slight decline in the rankings.
5th place – SET India
- Subscribers: 176 million
- Total Views: 168,769,362,926
SET India holds onto the fifth spot. Although its ranking has not changed, the channel continues to attract a vast number of viewers, solidifying its place in the top five.
Final thoughts
These numbers show YouTube’s rising impact in digital advertising and content creation. With retail and media industries leading the way, it’s clear that investing in YouTube can bring significant returns.
Whether you’re aiming to improve your ad campaigns or content strategy, these insights are crucial. Use them to sharpen your approach, increase engagement, and make a bigger impact on YouTube.
The post Key YouTube Stats You Need to Know This 2024 appeared first on jeffbullas.com.
* This article was originally published here


No comments:
Post a Comment